
July 14, 2000
Domestic Usage, Not Exports, Is Growth Engine Behind American Corn Market
Grain exports. Now there is a topic that we can chew on for a number of weeks. And, as a matter fact, we are going to.
Before we start, let me ask you a question. How do you think the average person on the street or your county commissioner, state legislator, senator or congressional representative would answer the following question: “Which do you think has been the driving force behind the increased demand for corn over the last fifteen years, exports or domestic use?”
If they have heard or overheard even a small amount of the rhetoric that surrounds the discussion of grain agriculture and farm policy over the years, they are likely to give you an ‘everybody knows that’ look and declare exports to be corn’s demand locomotive. And you may get same response from the farmer down the road, your farm loan officer, and representatives of ag-related organizations.
So, have exports been the major demand growth factor for corn? Well, let’s take a look…
Figure 1 graphs domestic and export demand for corn over the 1976 to 1999 period along with averages for the ten-year periods before and after the beginning of the 1985 Farm Bill and the first four years of the current bill. As you can see, corn exports trended upward from 1976 to about 1980, dropped back by 1982 and then flattened out. The average annual corn export for the last period, 1996-99, is 122 million bushels less than the average for the first period, 1976-85. In terms of value, corn exports earned approximately $3.6 billion for both the first and last years (1976 and 1999) shown in the graph. Clearly, exports have not been corn’s demand growth engine.
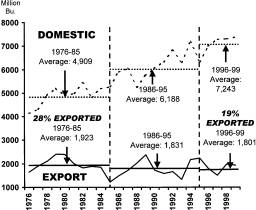
Figure 1. U.S. Domestic and Export Demand for Corn
Domestic demand, on the other hand exhibits an upward trend over the full period. The average annual domestic corn demand for the 1996-99 period is 2.3 billion bushels above the average annual domestic use during 1976-85 period, a 48% increase.
With domestic demand growing and exports flat, export’s share of total corn demand trends downward. During the first period, 1976-85, exports represented 28 percent of total corn demand but accounted for only 19 percent of total demand during the last period, 1996-99.
The corn numbers are not adjusted to reflect net exports of livestock products on corn usage. Even though livestock exports have increased significantly as of late, the U.S. continues to import more red meat than it exports. So we are also importing feed via livestock product imports as well as exporting feed via livestock product exports.
In addition, much of the poultry exports, including giblets, necks and dark meat, are complements to the preferred poultry cuts in the U.S. So, it is not clear how much less corn the poultry industry would demand without this segment of poultry exports.
One estimate is that a net of between 100 and 300 million bushels of corn’s demand would shift from domestic to export demand if corn fed to imported and exported livestock was included in the equation. After such an adjustment, average corn exports for the 1996-99 period would increase somewhat but the overall story would be same: average domestic demand between the ten-year period before the 1985 farm bill and the four-year period under the 1996 legislation would increase by over 2 billion bushels while average corn exports would then increase by about a 100 million bushel – a twenty to one ratio, decisive by anyone’s measure.
So, the next time you hear someone spout the ‘grain export conventional wisdom,’ have them look up the numbers. Over the last 24 years, domestic consumption—not exports—has been the unrecognized driving force behind the growth in the U.S. corn market!
During our next time, we will look up and report the numbers for soybean and wheat exports and domestic demand.
Daryll E. Ray holds the Blasingame Chair of Excellence in Agricultural Policy, Institute of Agriculture, University of Tennessee, and is the Director of the UT’s Agricultural Policy Analysis Center. (865) 974-7407; Fax: (865) 974-7298; dray@utk.edu; http://agpolicy.org.
Reproduction Permission Granted with
1) Full attribution to Daryll E. Ray and the Agricultural Policy Analysis Center, University of Tennessee, Knoxville, TN;
2) An email sent to hdschaffer@utk.edu indicating how often you intend on running Dr. Ray’s column and your total circulation. Also, please send one copy of the first issue with Dr. Ray’s column in it to Harwood Schaffer, Agricultural Policy Analysis Center, 310 Morgan Hall, Knoxville, TN 37996-001.