
August 11, 2000
Allowing Grain Prices to Fall Does Not Stave Off Loss of Export Market Share
Last week we saw that U.S. corn exports have accounted for a decreasing share of world corn exports over the last two and a half decades. So in the two columns dealing with corn export demand, we have learned that U.S. corn export demand is declining both as a share of total utilization in the U.S. and as a share of total corn exports worldwide. Is corn an aberration?
We saw a couple of weeks ago that soybean exports are also flat and account for a declining share of total U.S. soybean utilization. Wheat exports have declined dramatically since the early 80s, a time when wheat exports accounted for nearly two-thirds of total U.S. wheat use compared to one-third now.
So how have U.S. soybeans and wheat fared in the world market? Have the lower support prices and other export enhancing provisions of farm legislation since 1985 caused the U.S. soybean and wheat exports to capture a larger share of world exports? Let’s look at the data.
Figures 1 and 2 illustrate the share of the world market held by U.S. exports in the world soybean and world wheat markets. The charts graph year by year data as well as the average for the ten years before the 1985 farm bill, the ten years after and the first four years of Freedom to Farm.
The U.S. average share of world soybean exports (Figure 1) dropped considerably in the 1986-95 time-frame compared to the prior ten year average and continued to decline for the 1996-99 period even as soybean prices were declining. These numbers do not include meal exports. If they did, the scale would change and the percentage point drops between the first and second period averages would be greater since export market share eroded at a faster rate for soybean meal than for soybeans during that time. The percentage point drop between the second and last period would be slightly less if meal were included. From the first period to the last, the U.S. share of the world soybean dropped 22 percentage points from 80% to 58%.
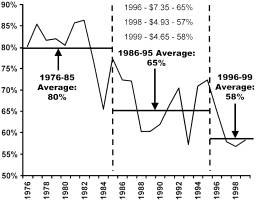
Figure 1. U.S. Exports as a percentage of World Soybean Markets
Again, on a year-to-year basis, note that the lowest U.S. market share for soybeans during the 24-year period occurred when the season average price of soybeans was $4.93 per bushel in 1998. The 1999 expected share was only slightly improved and the season average price was the lowest in 28 years.
During the ten years before the 1985 Farm Bill, the season average price of soybeans ranged from $5.05 to $7.83 and the U.S. share of world soybean exports averaged 80%. Contrast that with the last four years where the soybean price was in a similar range ($7.35 per bushel in 1996 to $4.65 per bushel in 1999) and the U.S. share varied little from the 59% period average share.
Figure 2 shows information on the changes in U.S. wheat export share since 1976. The trend is clearly down with the rate of decline steeper than for corn and roughly comparable to soybeans. Note that wheat export shares varied very little the last four years, but the wheat price went from $4.30 per bushel in 1996 to $2.50 per bushel in 1999.
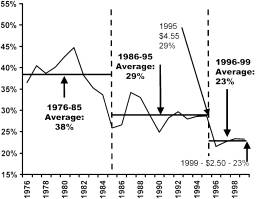
Figure 2. U.S. Exports as a percentage of World Wheat Markets
Daryll E. Ray holds the Blasingame Chair of Excellence in Agricultural Policy, Institute of Agriculture, University of Tennessee, and is the Director of the UT’s Agricultural Policy Analysis Center. (865) 974-7407; Fax: (865) 974-7298; E-mail: dray@utk.edu: Web Address: http://agpolicy.org
Reproduction Permission Granted with
1) Full attribution to Daryll E. Ray and the Agricultural Policy Analysis Center, University of Tennessee, Knoxville, TN;
2) An email sent to hdschaffer@utk.edu indicating how often you intend on running Dr. Ray’s column and your total circulation. Also, please send one copy of the first issue with Dr. Ray’s column in it to Harwood Schaffer, Agricultural Policy Analysis Center, 310 Morgan Hall, Knoxville, TN 37996-001.