
March 2, 2001
The Asian Crisis and the Corn Market
Recently we have been examining the impact of the Asian Crisis on crop agriculture. We began looking at this because much of what you see written blames the Asian Crisis and a slow down in global demand for the dramatic drop in farm prices and incomes of recent years.
After looking at trade data for cotton, rice, wheat and soybeans, my conclusion is that the Asian Crisis had a very small negative impact on U.S. exports of these crops during 1997, 1998 and 1999 and therefore deserves little of the blame for the decline in crop prices and incomes during that time.
A more dominant, reoccurring causal factor for the changes in U.S exports of those four crops was the variation in crop production of our export competitors. The export levels of our competitors are directly tied to their surplus production (production minus domestic demand). With our competitor’s domestic demand increasing at a steady pace, changes in production levels are funneled to the export market, as they keep a relatively consistent level of carryover stocks.
Argentina’s corn exports illustrate this export behavior. In Figure 1, Argentina’s surplus production (production minus domestic demand) is graphed along with Argentina’s exports. Clearly, in any given year, Argentina exports ALL of its surplus production. Our analysis shows that, with the major exception of China, our other corn export competitors also export virtually all of their surplus production.
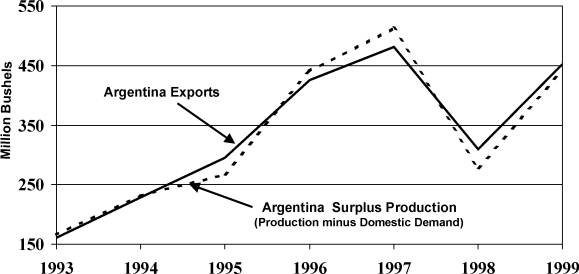
Figure 1. Comparison of Argentina’s corn exports with Argentina’s surplus corn production (production minus domestic demand). In any given year Argentina exports virtually all of its surplus production whether the price is $3.24 per bushel as it was in 1995 or $1.80 per bushel in 1999. With the exception of China this type of action is typical of the United States’ corn export competitors.
What also becomes clear in our analysis is that the years of reduced U.S. exports most often occur when our export competitors have “good-production” years and, therefore, have a larger exportable surplus. In a given year, how much our export competitors have to export has had more of an affect on the level of U.S. exports in recent years than changes in import demand by Asian and other countries. The “level of our competitors exportable surplus” as a major determinant of a given year’s U.S. export level, is particularly evident in the case of corn as can be seen in Figure 2. While the U.S. may be the world’s major corn supplier, oddly enough, it is also the world’s residual supplier.
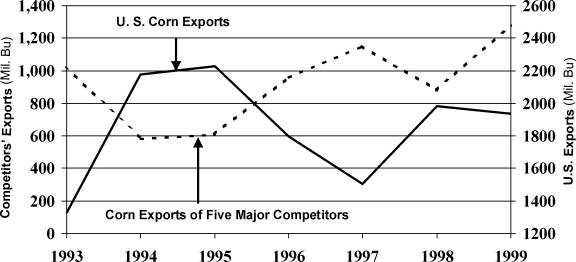
Figure 2. Comparison of the level of U.S. corn exports with the aggregate corn exports of our five major competitors (Argentina, China, EU, Hungary and Romania). The level of U.S. corn exports is inversely related to the export levels of our competitors. With these competitors (except China) exporting virtually all of their surplus production in the year it is produced, without regard to price, the United States becomes the residual supplier.
With that in mind, let’s do a year-by-year examination of the recent changes in corn trade and U.S. exports.
1996 Corn Crop Year
U.S. export demand for corn fell 430 million bushels in crop year 1996. In this year before the Asian Crisis, world corn exports were down by 151 million bushels with imports to the Asian countries off just slightly. With an increase in world consumption of 4.4 percent but a reduction in U.S. exports of 20 percent, the likely explanation is that we lost-out to our export competitors.
That is exactly what happened with China and Argentina being the major culprits, joined at lower levels by Hungary, the EU and Romania. Together these five countries increased their exports by 352 million bushels.
1997 Corn Crop Year
During the 1997 corn standard trade year, which coincides with the first year of the Asian Crisis, the combined imports of the countries most affected by the Asian Crisis (Japan, Indonesia, South Korea, Thailand, Taiwan, Malaysia, Philippines and Hong Kong) decreased their imports of corn by 6.34% or 85 million bushels. U.S. exports declined by 293 million bushels while corn exports by our five major competitors increased by 189 million bushels. China accounted for 90 million bushels of this increase. Driving this increase in Chinese exports was a1996 crop year increase in corn production of 594 million bushels and a 2,006 million bushel carryover¾unlike our other competitors, China tends to increase its exports in the year following an increase in surplus production.
One could attribute the loss of U.S. exports to the strong U.S. dollar during a time when the Asian Crisis resulted in currency devaluations by our export competitors. However, when our competitors export all of their surplus production, no matter what the price, (Figure 1), favorable exchange rates, compared to the U.S. dollar, may affect the rate at which the country’s surplus production is sold to bargain-hunting importers but the quantity exported in unaffected.
1998 Corn Crop Year
The big story in corn for the 1998 Standard Trade year was a worldwide increase in production of 1.159 billion (with a “B”) bushels while domestic demand increased by 108 million (with an “M”) bushels. Most of the production increase occurred in the U.S. and China. The Asian Crisis countries decreased their imports of corn by 6 million bushels.
Corn production in the rest of the world, on the other hand, declined by 521 million bushels. Lower production levels in importing countries resulted in increased U.S. corn exports of 476 million bushels to 1,981 million bushels—the third highest level in a decade.
However, with U.S. and world production increasing faster than demand and with carryover stocks growing, the U.S. season average corn price dropped for a third year in a row to 1.94/bu. Did the Asian Crisis play a role in dampening the growth in demand for corn? Possibly, but had world corn demand increased at a more typical rate, world carryover stocks would have still increased by a nearly 600 million bushels, putting substantial downward pressure on corn prices.
1999 Corn Crop Year
In 1999, world corn demand increased by 866 million bushels or 3.79%, making up in part for the lackluster world demand growth of the previous year. But even so, supply exceeded demand by .4% and carryover stocks grew once again. U. S. exports were down slightly while our five major competitors increased their exports by 400 million bushels. The average crop year corn price dropped by another 14¢.
So What Happened?
Over the last four years, changes in our competitors’ production surplus (difference between production and domestic demand) have greatly affected the level of US corn exports. With demand on a relatively steady increase, the small reduction in corn imports by countries affected by the Asian Crisis is swamped by the large changes in corn production in the U.S. and our major export competitors. The lead actor in agriculture’s ongoing saga is production. The Asian Crisis is a walk-on, taking its place in the crowd scene at the back of the stage.
So the next time you hear someone blaming agriculture’s woes on the Asian Crisis, ask them to “show you the data.”
Daryll E. Ray holds the Blasingame Chair of Excellence in Agricultural Policy, Institute of Agriculture, University of Tennessee, and is the Director of the UT’s Agricultural Policy Analysis Center. (865) 974-7407; Fax: (865) 974-7298; dray@utk.edu; http://apacweb.ag.utk.edu/.
Reproduction Permission Granted with:
1) Full attribution to Daryll E. Ray and the Agricultural Policy Analysis Center, University of Tennessee, Knoxville, TN;
2) An email sent to hdschaffer@utk.edu indicating how often you intend on running Dr. Ray’s column and your total circulation. Also, please send one copy of the first issue with Dr. Ray’s column in it to Harwood Schaffer, Agricultural Policy Analysis Center, 310 Morgan Hall, Knoxville, TN 37996-4500.