
March 16, 2001
Data Safari Shows that World Crop Demand Actually INCREASED during Last Four Years
Of late, we have been on a data safari. We are hunting for the information-specifics on the reduced international demand that is being blamed for the downturn in U.S. crop agriculture over the last four years. Our first stop was the Asian Crisis countries. From there, we expanded our inquiry to all of Asia. Our findings were:
U.S. exports of grains did decline substantially in the 1996 and 1997 marketing years, partially due to reduced exports to the Asian Crisis countries.
- BUT the 1996 reduction cannot be blamed on the Asian Crisis because the Asian Crisis had not yet occurred. It began in late calendar year 1997 and was full-blown in calendar year 1998.
- Even more surprising, domestic grain demand—that is, grain consumption—in the Asian Crisis countries declined slightly in only one of the years and the size of that decline in 1997 was less than half of the size of decline in U.S. exports. This is surprising because it was expected that the financial crisis during late 1997 and 1998 was a major cause of reduced crop demand during the 1997 to 1999 period.
- Rather than reduced crop demand by Asian Crisis counties, it was increased production in the Asian Crisis countries and by our export competitors that caused U.S. grain exports to these countries to decline during portions of the last four years.
When all of Asia is considered, the two most striking findings are:
- First, while per capita incomes grew at extremely high rates, domestic demand for crops was not accelerating during the early 1990s as was commonly asserted in the mid-90s.
- Secondly, Asian domestic crop demand grew at roughly the same average rate as the preceding five years. Reduced Asia domestic demand should not be blamed for crop agriculture’s price and income problems.
Now let’s expand beyond Asia to look at worldwide crop demand conditions. Was slackened worldwide demand during the last four years (1996-1999) responsible for the price-income problems facing U.S. farmers?
An examination of Figure 1 shows that world domestic demand for the five crops¾corn, cotton, rice, soybeans and wheat¾steadily increased throughout the 1981 to 1999 period. Clearly, worldwide demand for the five crops did not decline from 1996 to 1999. Average demand during the first four years of the 1996 Farm Bill was 152 million metric tons greater than the average for the previous five years.
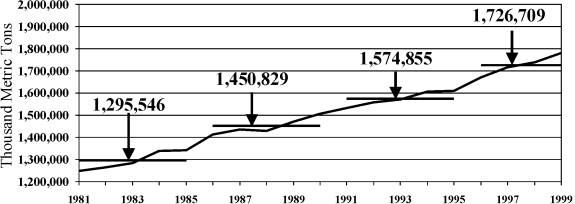
Figure 1. Composite world domestic demand for corn, cotton, rice, soybeans and wheat, 1981-1999. It can be seen that while, in the long run, demand is increasing, there are also years where demand does not grow significantly from the previous year (1984-85, 1987-88, and 1994-95).
Okay, but what about the rate of growth in world domestic demand? Has that slackened? In a word, NO. But as can be seen in Figure 2, rates of growth vary from year to another so, for certain pairs of years, the rate of growth shows declines.
Note, however, that for the years covered by the 1996 Farm Bill the rates of growth were lowest in 1998 and 1999 when grain export demand tended to increase and the rates of worldwide domestic demand were the highest in 1996 and 1997 when grain (mostly corn) export demand fell off sharply. Also, note that the annual variation in worldwide domestic demand growth during the four years is well within the historic range of the last nineteen years.
Average rates of growth over a period of years are often more informative than for a single year. Comparing the average rate of growth for the four years 1996 to 1999 with the three previous five-year periods, worldwide domestic demand increased faster during these years covered by the 1996 Farm Bill than for any of the periods. Even if 1996 is taken out leaving the Asian Crisis years of 1997-1999, the average annual increase in world domestic demand is 2.11%, well above the average growth rate from 1991 to 1995, which many have implied was a high growth period.
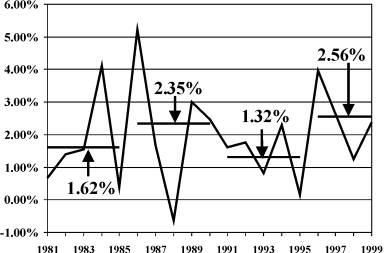
Figure 2. Annual percentage growth in world domestic demand for corn, cotton, rice, soybeans and wheat, with period averages shown, 1981-1999.
We also examined rates of growth in foreign demand (world minus the U.S.). For the 1991-1995 period, foreign domestic demand grew by an average of 1.43% per year while the average growth rate for the 1996-1999 period was 2.29% per year. The same pattern is observed when only developed countries’ domestic demand growth rates are compared and when only less developed countries are considered. In all cases, average domestic demand for the 1996 to 1999 period grew at a higher rate than for the 1991 to 1995 period. By any measure, it is clear that demand for the five crops has increased¾not decreased, as many have suggested¾during the first four years of the 1996 Farm Bill.
Depressed growth in demand clearly did not cause the price and income problems faced by U.S. and world crop farmers. The problem was increased supply—here in the U.S., among our export competitor countries and among our export customer countries—not reduced domestic demand by the Asian Crisis countries, all of Asia or worldwide (Figure 3).
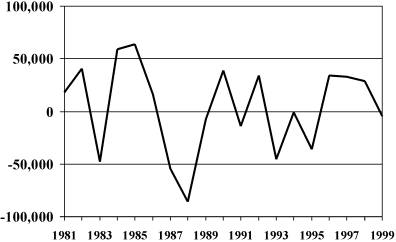
Figure 3. Net difference in world production and world domestic demand for the five crops¾corn, cotton, rice, soybeans and wheat, 1981-1999. In the 1991-1995 period, world production of the five crops exceeded demand in only one year. Contrast that to the last four years when world production exceeded world domestic demand in three years.
In the movie Jerry McGuire, the character played by Cuba Gooding, Jr. creates a memorable image as he jumps up and down crying, “Show me the money! Show me the money!” The next time you hear someone blame the current price-income problems in crop agriculture on the Asian Crisis and/or slackened world demand, you just might want to jump up and down and cry out, “Show me the data! Show me the data!”
Daryll E. Ray holds the Blasingame Chair of Excellence in Agricultural Policy, Institute of Agriculture, University of Tennessee, and is the Director of the UT’s Agricultural Policy Analysis Center. (865) 974-7407; Fax: (865) 974-7298; dray@utk.edu; http://apacweb.ag.utk.edu/.
Reproduction Permission Granted with:
1) Full attribution to Daryll E. Ray and the Agricultural Policy Analysis Center, University of Tennessee, Knoxville, TN;
2) An email sent to hdschaffer@utk.edu indicating how often you intend on running Dr. Ray’s column and your total circulation. Also, please send one copy of the first issue with Dr. Ray’s column in it to Harwood Schaffer, Agricultural Policy Analysis Center, 310 Morgan Hall, Knoxville, TN 37996-4500.