
June 1, 2001
Our Export Competitors Harvest 36 Million More Acres Following 1996 FB
As we have discussed before, it seems clear that the worldwide decline in grain prices and market incomes is largely due to increased total crop supplies in the U.S. and around the world.
This is true despite the fact that—contrary to what many have said—worldwide domestic utilization grew faster during the second half of the 1990s than the first half. While it is difficult to disentangle demand shifts from price-induced changes in quantities demanded, this quickened increase in worldwide grain utilization was still insufficient to overcome even greater increases in grain supplies. Above-trend yields explain a portion of the supply increase, but acreage effects have also had an impact.
It’s those acreage effects that we want to discuss this time around. As is often the case, the data reveal happenings that are unexpected and somewhat surprising.
For example, even though total foreign grain production is up since the
mid-1990s, 1999 total grain acreage outside the U.S. and total foreign acreage in 1999 for the 8 major crops are down compared to 1995. In fact, this acreage decline has been cited by some as confirmation that the elimination of U.S. set asides and allowing prices to fall below loan rates have had the desired effect on international acreage levels. But, is this really the case? What’s particularly interesting about the foreign acreage change between 1995 and 1999 is its geographical distribution.
Total harvested acreage for the eight major crops (corn, soybeans, wheat, barley, oats, grain sorghum, rice and cotton) is used in this analysis. While we would prefer to use planted acres as a measure of growers’ intentions, harvested acreage is used because USDA’s PS&D database does not provide information on planted acres.
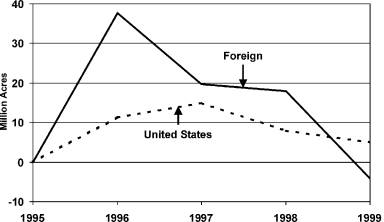
Figure 1. Gain or loss in foreign and U.S. harvested acres when compared to 1995. Foreign acreage increased by 37.6 million acres in 1996 and decreased in each of the next three years. (Source: USDA-PS&D)
To begin, let’s review what happened to total acreage of major crops in the U.S. and the rest of the world between 1995, the last year prior to the 1996 Farm Bill, and 1999. Figure 1 shows that both U.S. acreage and foreign acreage jumped the first year of the 1996 Farm Bill. Compared to 1995, foreign harvested acreage of the eight major crops increased by 37 million acres (2.9%) in 1996. By 1997, U.S. acreage increased by 15 million acres (6.7%) but the increase was shaved down to 5 million acres by 1999 (2.3% above 1995).
All of the initial 37 million acre increase among non-U.S. countries melted away and by 1999, total foreign acreage for the 8 major crops fell below its 1995 level. Such a reduction in foreign crop acreage was one of the expected effects of the 1996 Farm Bill’s elimination of set asides and the dismantling of floors under crop prices. And some have declared victory in that regard. But look at figure 2.
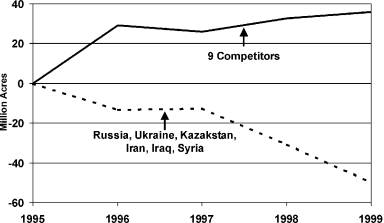
Figure 2. Gain or loss in harvested acres by 9 competing exporting countries and by a grouping of three former Soviet Union republics and three Middle East countries when compared to 1995. The 9 competing exporting countries include Canada, the European Union (15), Brazil, Argentina, Australia, India, Pakistan, Thailand and Vietnam. (Source: USDA-PS&D)
It turns out that three countries in the former Soviet Union—Russia, Ukraine and Kazakstan—have experienced a 42 million acre decline in major crops, especially barley, between 1995 and 1999. Much of this acreage reduction is due to reduced crop demands stemming from the turmoil of herd liquidations and problems of transitioning to a more private enterprise based economic system. This 42 million acre reduction in harvested area follows a 25 million acre drop between 1988 and 1995. Given this history, it seems unlikely to me that the release of U.S. set aside acreages and removal of U.S. crop price floors in the 1996 Farm Bill played a significant role in the acreage reduction decisions of Russia, Ukraine, or Kazakstan.
Three other countries, Iraq, Iran, and Syria, account for an additional 8 million-acre decrease in crop acreage. The trade embargoes and/or tensions with these three countries also make it doubtful that U.S. farm policy is a primary factor in their crop planting decisions.
On the other hand, our major export competitors—the group of countries that we felt our change in policy would affect—have increased harvested acreage of the eight major crops by 36 million acres between 1995 and 1999. Argentina, Australia, EU-15, Brazil and Canada have a 21 million acre net increase in major crop acreage while India, Thailand, Vietnam, and Pakistan account for the remaining 15 million acres.
So while foreign acreage of major crops has declined since 1995, the decline has been in countries that have little impact on international markets and, therefore, on the U.S. It’s the 36 million acre increase by our export competitors that is of more concern.
Daryll E. Ray holds the Blasingame Chair of Excellence in Agricultural Policy, Institute of Agriculture, University of Tennessee, and is the Director of the UT’s Agricultural Policy Analysis Center. (865) 974-7407; Fax: (865) 974-7298; dray@utk.edu; http://www.agpolicy.org.
Reproduction Permission Granted with:
1) Full attribution to Daryll E. Ray and the Agricultural Policy Analysis Center, University of Tennessee, Knoxville, TN;
2) An email sent to hdschaffer@utk.edu indicating how often you intend on running Dr. Ray’s column and your total circulation. Also, please send one copy of the first issue with Dr. Ray’s column in it to Harwood Schaffer, Agricultural Policy Analysis Center, 310 Morgan Hall, Knoxville, TN 37996-4500.