
March 15, 2002
Is it $6 billion or $50+ billion?
Late last week it was revealed that CBO miscalculated the cost of the Senate version of a farm bill. The mistake, a $6 billion increase, has sent Senate conferees into a tizzy as they try to decide what to do next. The mistake certainly adds an interesting twist to what has already become a nerve-wracking experience for farmers and their bankers trying to get ready for the 2002 crop year without the benefit of a game rule book. Winter wheat producers and many other farmers have made final crop-acreage decisions despite the uncertainty.
Six billion is a significant amount of money, even under former Illinois Senator Everett Dirksen’s definition—“a billion here, a billion there, before long it amounts to real money” (or something like that). On the other hand, it’s a mere four percent of the total budgeted for agriculture over the next ten years. How big a deal is it compared to cost overrun for the 1996 Farm Bill? It’s not even in the same league. The cost overrun for the 1996 Farm Bill is over one hundred percent and still counting.
I know some would say that is not fair to include the “emergency payments” when computing the 1996 Farm Bill’s overrun since those payments were not part of the bill. But to me, taking a don’t-count-the-emergency-payments-position implies that those who voted for the 1996 Farm Bill knew how low prices and incomes could go under the bill and that was okay with them—a possible but unlikely anticipation/reaction combination in my view.
The consensus in 1996 was that imports of grain and soybeans and meal to China and other fast growing developing economies were at the “take-off” stage which, in most analysts’ view, promised to propel U.S. crop agriculture into a new orbit of export-based prosperity. While it is important to know about single digit calculation errors, in light of the 1996 overrun experience it may be more important to investigate the export-assumption base upon which the cost of 2002 farm bill proposals are being estimated.
Figure 1 shows a comparison of corn export projections used in 1996 and those in use now and it is not very reassuring. The left-most broken line (FAPRI 12-1995 Projection) shows the U.S. corn export projections for 1996 through 2004 in use during the debate on the 1996 Farm Bill. The broken line further to the right (CBO 4-2001 Projection) displays the corn export numbers that underlie the Congressionally mandated CBO set of baseline estimates of price, market income and government payment for 2002 farm bill proposals. The 2001 USDA (United States Department of Agriculture) and FAPRI (Food and Agricultural Policy Research Institute) baselines show similar numbers to CBO (Congressional Budget Office).
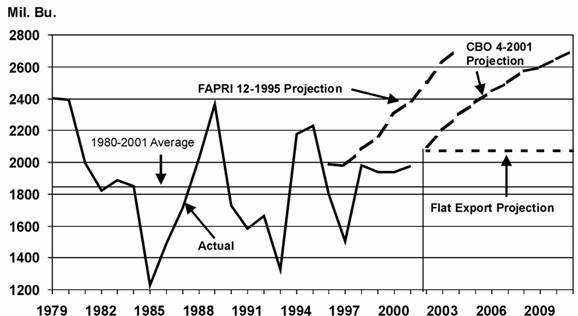
Figure 1. U.S. corn exports actual 1979-2001, projections 1996-2003 and 2002-2011, and average 1980-2011. The average of U.S. corn exports for the 1980-2001 period was 1,846 million bushels a year, some 23 percent lower than the 1979 peak. The FAPRI 12-1995 projections were in use during the months leading up to the adoption of the 1996 Farm Bill. The CBO 4-2001 projections for the 2002-2011 period are included in the baseline that the Congressional Budget Office is using to estimate the potential cost of farm bill proposals. The flat export projections set corn exports at 2,075 million bushels a year for the 2002-2011 period. Sources: USDA PS&D, FAPRI December 1965 Baseline, and Congressional Budget Office April 2001 Baseline. Note: the vertical axis begins at 1,200 million bushels not zero.
Knowing that rosy export projections have become notorious in their infrequency of realization, so-to-speak, we used our modeling system at APAC to estimate the increase in government cost for the House and Senate farm bill proposals under two more conservative corn and wheat export scenarios.
The first scenario assumed corn (fig 1. Flat Export Projections) and wheat exports were flat over the ten year period at about their current levels. This scenario showed a ten-year cost for the House proposal to be nearly $220 billion and the cost of the Senate bill to be in the neighborhood of $236 billion. This is an increase in the ten-year cost of the House proposal of $49 billion ($66 billion for the Senate proposal) OVER AND ABOVE the $170 billion cap agreed to by congressional leaders and the administration.
The second scenario held corn exports at their 1980-2001 average and wheat exports at one billion bushels over the ten years. The corn 1980 to 2001 average and wheat at one billion bushel export scenario would cost an extra $88 billion (over and above the $170 billion cap) under the House version and $103 billion (over and above the $170 billion cap) under the Senate version. WTO limits were not considered but, of course, will have to be addressed if overruns of these magnitudes occur. However, the bulk of the increases in expenditures are in the latter years, years in which most analyses of the House and Senate proposals show declining program costs.
Yes, $6 billion is a lot of money. But maybe we should be prepared for an overrun of a much larger magnitude—not from a miscalculation but from a missing upward projectile on crop exports.
Daryll E. Ray holds the Blasingame Chair of Excellence in Agricultural Policy, Institute of Agriculture, University of Tennessee, and is the Director of the UT’s Agricultural Policy Analysis Center. (865) 974-7407; Fax: (865) 974-7298; dray@utk.edu; http://www.agpolicy.org.
Reproduction Permission Granted with:
1) Full attribution to Daryll E. Ray and the Agricultural Policy Analysis Center, University of Tennessee, Knoxville, TN;
2) An email sent to hdschaffer@utk.edu indicating how often you intend on running Dr. Ray’s column and your total circulation. Also, please send one copy of the first issue with Dr. Ray’s column in it to Harwood Schaffer, Agricultural Policy Analysis Center, 310 Morgan Hall, Knoxville, TN 37996-4500.