
Multi-year stretches of corn prices have been shaped by federal policy and world wars
One of the issues that intrigues us as agricultural policy analysts is the factors that influence crop prices over long periods of time. Recently we decided to seriously examine corn prices. While agriculture was important in the early history, it was not until 1862 that the federal government established the United States Department of Agriculture (USDA). By 1866, the USDA was reporting annual production and season average prices for farm commodities, including corn (these data are available at https://quickstats.nass.usda.gov/).
To begin our analysis, we graphed the annual corn price beginning with 1866 and ending with the culmination of WWII in the 1945 crop year (See Figure 1). One-year price spikes are apparent throughout the whole 80-year period. An examination of the data showed that these spikes correspond to significant shortfalls in corn production. On average these weather events added $0.184 to the price of corn during years of significant production shortfalls.
In looking at the graph, it becomes immediately apparent that the price line is not smooth, and a number of periods are apparent, some more than others.
The first inflection point comes in the mid-1890s with the end of a long period of generally declining corn prices. Interestingly, this inflection point closely coincides with a presentation at the 1893 meeting of the American Historical Association by University of Wisconsin professor Frederick Jackson Turner. In his presentation he argued that the American Frontier had closed, ending a distinctive and formative period in US history. It turns out that the period of the rapid increase in corn acres also ended during the mid-to-late1890s.
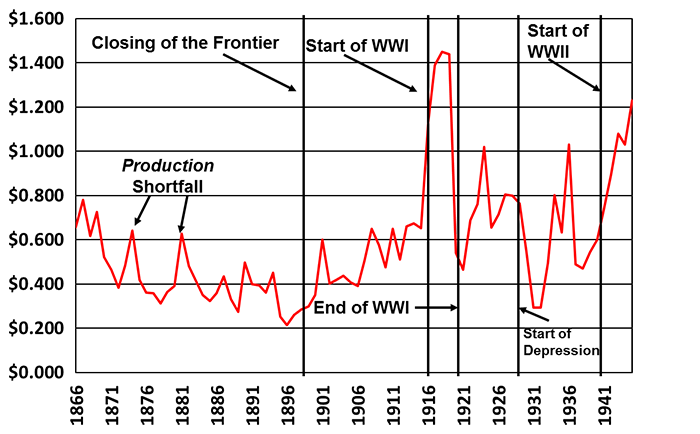
Figure 1. US corn prices, 1867-1945, and price periods (Data source USDA NASS)
In recent years, agricultural economists have identified the year-ending stocks-to-use ratio as a major factor in price determination for a dominant crop like corn. But the USDA does not provide the data needed for determining the year-ending stocks-to-use ratio in the years before 1927, so we decided to look at the data that was available, annual production. We theorized that if farmers and grain merchandizers were going to use something to provide a guidance in price determination, it would have to be information that was publicly available in that period of time and total annual production is the likeliest candidate. In addition, yield was an unlikely factor because it remained flat across the whole period and did not begin to increase until the mid-1930s with the introduction of hybrid corn. Between 1866 and 1899 corn yields averaged 25.9 bushels per acre. Over the next 41 years, 1900-1940, corn yields averaged 26.1 bushels per acre per year.
Between 1866 and 1898, the price of corn declined from $0.65 per bushel to $0.29. Revenue per acre during that period was as high as $19.20 per acre in 1867 and as low as $6.42 per acre in 1896. The cause of the decline in prices and revenue per acre was the increase in the area planted for grain from 30.0 million acres in 1866 to 94.6 million acres in 1899 an increase of 2 million acres per year.
In the years between 1900 and the beginning of World War I, planted acres grew more slowly than in the in the previous period, increasing from 94.9 million acres to 100.6 million acres for an average annual increase of 0.4 million acres. In the 19 years from 1900 to 1915 prices increased by slightly more than 2 cents a year for any given production level compared to the 1866-1898 period. Given the level of production, the 1915 price of corn was $0.41 higher than it would have been in the earlier period. This period includes the 1909-1914 years during which farmers believed they had achieved price parity with their urban counterparts.
World War I began in July 1914, and while the US did not enter the war until 1917, it did actively support the Allied Powers with agricultural production. American producers were urged to increase their production, particularly hogs that were fed with corn. As a result, wartime corn prices were $0.76 higher for a given production level than they were at the end of the previous period.
Between 1918 and 1920, corn prices declined from $1.45 per bushel to $0.54. From 1920-1929, corn prices ranged from $0.46 per bushel to $0.80 with one year at $1.02, a year that experienced a 20 percent decline in production.
The stock market crashed in 1929, triggering the Great Depression and by 1932 corn prices had dropped to $0.29 per bushel with lower prices in many parts of the country. The most recent time the annual corn price had been that low was 31 years earlier in 1898. During the first three years of the depression, for a given production level, corn prices were $0.41 lower than they were in the 1920s. For the 1933-1938 crops, New Deal agricultural policies raised corn prices so that they were only $0.20 lower than the 1920s. In 1939 and 1940, the price differential was only 10 cents.
Like World War I, World War II increased corn prices. This time the increase was $0.45 per bushel despite the fact that corn yields had increased from 28.9 bushels per acre in the year before the war to an average yield of 33.75 bushels per acre during the war years as the result of the more widespread planting of hybrid corn seeds.
So, what can we learn from all of this? Policies and wars can make a difference in the prices farmers receive for their crops. The upside of the developmental policies of the post-Civil War period was that they opened up millions of acres of land and subsistence economic employment for a growing national population. The downside was a 63 percent decline in corn prices between 1867 and 1898 with rural income falling well below urban income.
In the face of strong economic headwinds, the supply management policies of the New Deal were able to increase crop prices even though it took a war to bring both rural and urban residents out of the Great Depression.
Policy Pennings Column 962
Originally published in MidAmerica Farmer Grower, Vol. 37, No. 208, February 8, 2019
Dr. Harwood D. Schaffer: Adjunct Research Assistant Professor, Sociology Department, University of Tennessee and Director, Agricultural Policy Analysis Center. Dr. Daryll E. Ray: Emeritus Professor, Institute of Agriculture, University of Tennessee and Retired Director, Agricultural Policy Analysis Center.
Email: hdschaffer@utk.edu and dray@utk.edu; http://www.agpolicy.org.
Reproduction Permission Granted with: 1) Full attribution to Harwood D. Schaffer and Daryll E. Ray, Agricultural Policy Analysis Center, Knoxville, TN; 2) An email sent to hdschaffer@utk.edu indicating how often you intend on running the column and your total circulation. Also, please send one copy of the first issue with the column in it to Harwood Schaffer, Agricultural Policy Analysis Center, 1708 Capistrano Dr. Knoxville, TN 37922.