
Future US soybean exports will be largely determined by China and Brazil
Telling the story of soybean exports over the last 30 years requires a little more work than for corn and wheat. The primary products of soybeans—soybean meal and soybean oil—play a much larger role in exports than do the corresponding products of corn and wheat. As a result, the United States Department of Agriculture (USDA) tracks production and utilization data for soybean meal and soybean oil separately from unprocessed beans.
To get a picture of the scope of world trade that results from the raising of soybeans, we have added the meal and oil numbers to those of unprocessed soybeans to create a variable known as soybean complex. This is particularly important because exporters and importers trade in various proportions of the three products. As a result, looking at soybeans alone gives an incomplete picture of the impact of trade on the producers of soybeans.
Exports play a much larger role in soybeans than they do in corn and wheat. The proportion of the world’s corn crop that is exported has roughly fallen from 20 to 10 percent over the last 30 years, whereas wheat exports have hovered around the 20 percent level during the same time period. Soybean complex exports as a share of world production (Fig. 1), on the other hand, started the period near the 60 percent level, fell to below 50 percent, and then began a fairly steady climb to the mid-60 percent level as the result of Chinese imports.
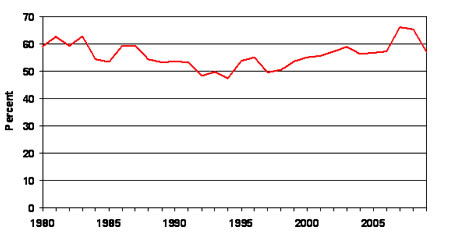
Figure 1. World soybean complex (soybeans, soybean meal, and soybean oil) exports as a percent of world soybean production, 1980-2009. Data source: USDA.
US soybean growers are slightly more dependent upon domestic markets than the Brazilians and Argentines. During most years since 1980, US soybean complex exports have accounted for less than half of the crop (Fig. 2). Most of the domestic consumption is in the form of soybean meal fed to animals and soybean oil used for food.
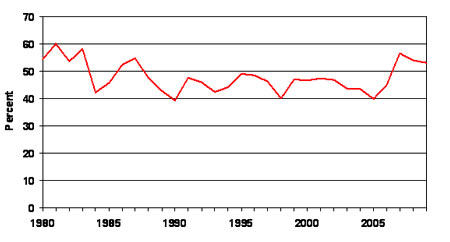
Figure 2. US soybean complex (soybeans, soybean meal, and soybean oil) exports as a percent of US soybean production, 1980-2009. Data source: USDA.
While US soybean complex exports have increased from 26 million metric tons (MMT) to 48 MMT over the last 30 years (Fig. 4 solid red line), the US share of world exports has fallen from 60 percent to 30 percent (Fig. 3 solid red line). This change has been the result of the dramatic increase in soybean production in Brazil and Argentina. In the future, the biggest increase in non-US exports of soybean complex will undoubtedly come from Brazil due its large land area. Given a relatively fixed crop area, the US will continue to see its share of world soybean complex exports fall.
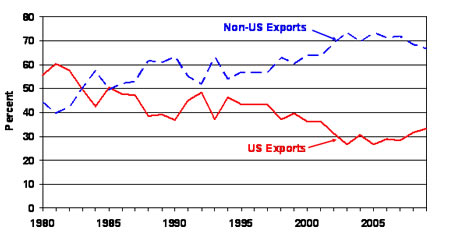
Figure 3. US and Non-US soybean complex exports as a share of world exports, 1980-2009. Data source USDA.
For the most part, over the last 30 years, the value of soybean complex exports (Fig. 4 dashed blue line)—using season average farmgate prices for soybeans and market season average prices for soybean meal and oil—has varied between $5 billion and $8 billion as the volume of exports (Fig. 4 solid red line) increased. The major exceptions were the 1995-1996 period and the years since 2007. In both of these periods, prices were well above the other years, with the most dramatic price peak occurring in 2008.
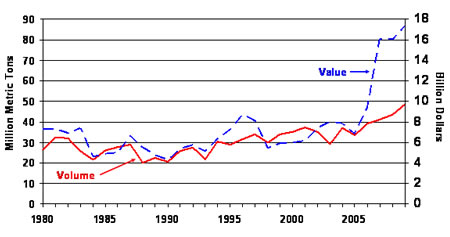
Figure 4. The Volume and value of US soybean complex exports, 1980-2009. Data source USDA.
The future profitability of US soybean production depends upon a couple of factors. First, during the 2009 crop year, China imported 42.5 MMT of soybeans, 29 percent of world soybean complex exports. While China has stated its intention to continue to import two-thirds of its soybean needs, a reduction in its imports—or even a slowing of its rate of increase in imports—would have negative price consequences. Second, a combination of yield and Brazilian production-growth-increases at a rate faster than the growth in world demand could also send prices downward. In the absence of the decision of the Chinese to begin to import soybeans, the picture over the last 15 years might have looked very different.
Daryll E. Ray holds the Blasingame Chair of Excellence in Agricultural Policy, Institute of Agriculture, University of Tennessee, and is the Director of UT’s Agricultural Policy Analysis Center (APAC). (865) 974-7407; Fax: (865) 974-7298; dray@utk.edu; http://www.agpolicy.org. Daryll Ray’s column is written with the research and assistance of Harwood D. Schaffer, Research Associate with APAC.
Reproduction Permission Granted with:
1) Full attribution to Daryll E. Ray and the Agricultural Policy Analysis Center, University of Tennessee, Knoxville, TN;
2) An email sent to hdschaffer@utk.edu indicating how often you intend on running Dr. Ray’s column and your total circulation. Also, please send one copy of the first issue with Dr. Ray’s column in it to Harwood Schaffer, Agricultural Policy Analysis Center, 309 Morgan Hall, Knoxville, TN 37996-4519.