
October 30, 2000
Wheat: Same Song, Third Verse
When people talk about acreage responsiveness to the lower prices realized under the 1996 Farm Bill, wheat is the crop they usually mention. Since the 1996 crop year, wheat planted acreage has declined 17% from 75.1 million acres to 62.0 for 2000. The bulk of the acreage reduction came from the heart of the wheat belt in a band from Minnesota, North and South Dakota and Montana through Nebraska and Kansas and into Oklahoma. Those seven states accounted for over 60 percent of the acreage reduction. This reduction is equivalent to all the acres planted to wheat in North Dakota in 1996. With acreage down by that much, things must be working well for wheat, right? Well no, because while acreage decreased each year (fig.1), production was above the 1996 level for all but the 2000 crop year and in that year production is only 17 million bushels below the 1996 level. Increased yields have more than made up for the drop in acreage.
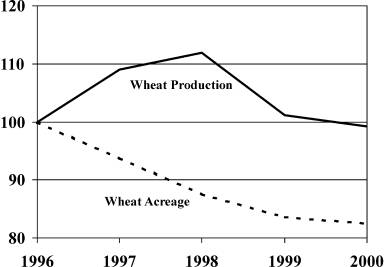
Figure 1. Indexed wheat production and planted acres, 1996=100.
For the 2000 crop year, Kansas farmers reduced their wheat acreage by 2.1 million acres from the 1993-95 three year average, while increasing overall acreage planted to seven major crops by 222,000 acres. Corn acreage increased by 1.25 million acres, soybeans by 817,000 acres, grain sorghum by 233,000 acres and cotton by 38,000 acres. They reduced barley and oat acreage by 6,000 and 10,000 acres, respectively.
In North Dakota, for the 2000 crop year, farmers reduced their wheat acres by 1.373 million acres from the same three year average. In addition barley and oats acres dropped by 667,000 and 170,000 acres, respectively. Soybean acreage was the big gainer adding 1.467 million acres with corn adding 350,000 acres.
Planting flexibility made a difference in where crops were grown and in the mix of crops. It affects the acreage of each crop in each region of the country.
When the 1996 Farm Bill was passed, the expectation was that decoupling contract payments from the acreage planting decision would allow U.S. producers to effectively compete in the world grain market and export more grain. Even though the price of wheat fell by nearly 40% from $4.30 per bushel in 1996 to $2.50 in 1999, the amount of wheat exported by the United States continued a steady decline that began following a peak in 1981 (fig. 2). In fact, wheat exports during the first four years of the 1996 Farm Bill were 17% less than under the previous legislation.
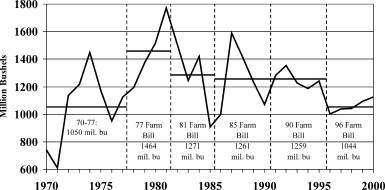
Figure 2. United States wheat exports, 1970-2000.
This is not the first time that wheat exports have not responded as advertised following price declines. Wheat was the “poster crop” during the debate for the 1985 Farm Bill a decade and a half ago. The erosion of U.S. share of world wheat exports in the early 1980’s was an important impetus for the reduced loan rates that were specified in the 1985 Farm Bill. However, even with lower loan rates and prices, U.S. wheat exports remained flat to declining in the years to follow. With world trade increasing moderately, the U.S. share of wheat exports continued on its downward trend. Not only were we unable to bring the European Union “to its knees” as the catch phrase used to be, we now learn that the European Union will be able to export wheat without export subsidies.
With increased production, steady to slightly higher domestic consumption, and lower exports, the level of carryover stocks began to increase (fig. 3). By the end of the 1999 crop year, U.S. carryover stocks stood at a level equal to 40% of annual utilization. As carryover stocks increased, wheat prices plummeted.
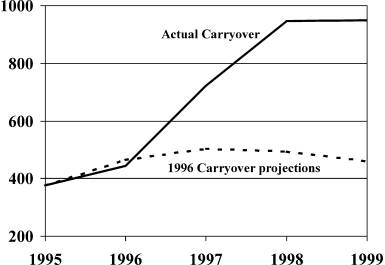
Figure 3. United States carryover of wheat, 1995-1999.
In the last several weeks we have looked at the story of three different crops. Each one has its own idiosyncrasies and yet they all have experienced the same thing: low prices and high inventories. In a system with production capacity in excess of demand, planting flexibility will affect the mix of crops and the location of production, but it will not solve the basic problem. Short of a weather-related calamity or political decision beyond the control of producers, we have the ability to simultaneously produce too much of everything. And that full use of general excess productive capacity results in a blanket of low prices over all crops.
Daryll E. Ray holds the Blasingame Chair of Excellence in Agricultural Policy, Institute of Agriculture, University of Tennessee, and is the Director of the UT’s Agricultural Policy Analysis Center. (865) 974-7407; Fax: (865) 974-7298; dray@utk.edu; http://agpolicy.org .
Reproduction Permission Granted with
1) Full attribution to Daryll E. Ray and the Agricultural Policy Analysis Center, University of Tennessee, Knoxville, TN;
2) An email sent to hdschaffer@utk.edu indicating how often you intend on running Dr. Ray’s column and your total circulation. Also, please send one copy of the first issue with Dr. Ray’s column in it to Harwood Schaffer, Agricultural Policy Analysis Center, 310 Morgan Hall, Knoxville, TN 37996-4500.