
Since 1980 US wheat exports down by half while competitors’ exports double
We continue our look at agricultural exports. Last week corn exports were the focus; this week we look at wheat.
Historically, exports have dominated the US wheat market. For the 32 years from 1960 to 1992, US wheat exports exceeded domestic consumption in all but 7 years. But now it’s the other way around.
From 1993 to 2009, domestic demand exceeded exports in 14 of those 16 years. This happened not because domestic wheat consumption has trended upward, but because US exports have declined over time. While US wheat exports have dropped markedly in terms of proportions of utilization and of production, those trends do not characterize the worldwide wheat market.
Since 1980, the percent of world wheat production entering the export/import market has been flat to down slightly (Fig. 1). During the 30-year period from 1980 to 2009, the production of wheat around the world grew by 52 percent while wheat exports grew by 36 percent.
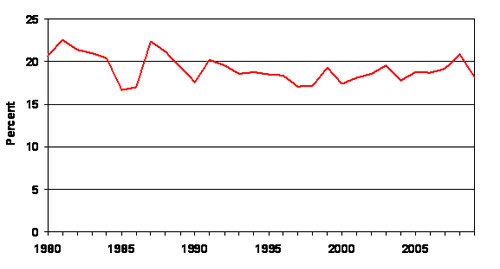
Figure 1. World wheat exports as a percent of world wheat production, 1980-2009. Data source: USDA.
In 1980, the US sold 1.5 billion bushels of wheat into the world export market (solid red line) for a 45.7 percent share of the worldwide market (Fig.2). Twenty-nine years later, US exports are down to 0.8 billion bushels, while Non-US wheat exports—exports of US wheat-export competitors—jumped to 3.7 billion bushels, up from 1.8 billion bushels in 1980 (dashed blue line).
In essence, between 1980 and 2009 US wheat exports declined by one-half while the quantity of Non-US exports doubled. The result of this divergence was a steady decline in the US share of world wheat exports, going from 45.7 percent in 1980 to 18.2 percent in 2009 (Fig 2, green knotted line and right axis)
With the adoption of the 1985 Farm Bill, the US embarked on an export oriented grain marketing strategy by reducing the loan rate in the belief that the loan rate was holding the US price above the “world price.” It was expected that by allowing the US price to fall to the “world price,” US grain exports—in this case wheat— would increase, displacing grain exports among our main international competitors.
As Figure 2 shows, the export oriented strategy of US policy makers did not stop the nearly steady decline in both the volume and the market share of US wheat exports as Non-US exports of wheat rose dramatically.
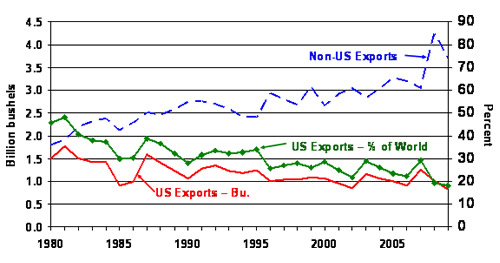
Figure 2. US and Non-US wheat export volume (left axis) and US wheat exports and a percent of world wheat exports (right axis), 1980-2009. Source data: USDA.
When we look at the US farmgate price of wheat (solid red line) in Figure 3 we see that it is closely related to the farmgate value of wheat exports (dashed blue line). If the low price strategy of the post-1985-Farm-Bill era were to have brought prosperity to crop agriculture as it was argued it would, export levels should have had to have increased at a rate faster than the rate of price decline, thus increasing the value of exports.
Clearly that did not happen.
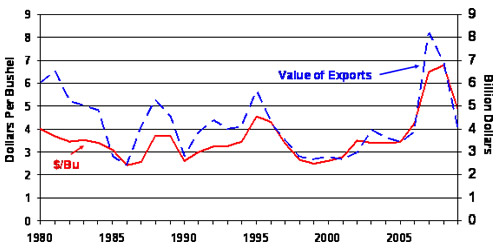
Fig 3. US wheat price and value of exports. Price and the value of exports are based on the season average price received by farmers. Data source: USDA.
Daryll E. Ray holds the Blasingame Chair of Excellence in Agricultural Policy, Institute of Agriculture, University of Tennessee, and is the Director of UT’s Agricultural Policy Analysis Center (APAC). (865) 974-7407; Fax: (865) 974-7298; dray@utk.edu; http://www.agpolicy.org. Daryll Ray’s column is written with the research and assistance of Harwood D. Schaffer, Research Associate with APAC.
Reproduction Permission Granted with:
1) Full attribution to Daryll E. Ray and the Agricultural Policy Analysis Center, University of Tennessee, Knoxville, TN;
2) An email sent to hdschaffer@utk.edu indicating how often you intend on running Dr. Ray’s column and your total circulation. Also, please send one copy of the first issue with Dr. Ray’s column in it to Harwood Schaffer, Agricultural Policy Analysis Center, 309 Morgan Hall, Knoxville, TN 37996-4519.